Golang HTTP Performance and Errors Monitoring
You can monitor HTTP performance and errors using OpenTelemetry tracing and OpenTelemetry metrics.
What is OpenTelemetry?
OpenTelemetry is a vendor-neutral API for distributed traces and metrics. It specifies how to collect and send telemetry data to backend platforms. It means that you can instrument your application once and then add or change vendors (backends) as required.
Otel allows developers to collect and export telemetry data in a vendor agnostic way. With OpenTelemetry, you can instrument your application once and then add or change vendors without changing the instrumentation, for example, here is a list popular DataDog competitors that support OpenTelemetry.
BunRouter OpenTelemetry instrumentation
BunRouter comes with an OpenTelemetry instrumentation called bunrouterotel that is distributed as a separate module:
go get github.com/uptrace/bunrouter/extra/bunrouterotel
To instrument BunRouter, you need to add the middleware provided by bunrouterotel:
import (
	"github.com/uptrace/bunrouter/extra/bunrouterotel"
	"go.opentelemetry.io/contrib/instrumentation/net/http/otelhttp"
)

router := bunrouter.New(
	bunrouter.Use(bunrouterotel.NewMiddleware(
		bunrouterotel.WithClientIP(),
	)),
)
handler := otelhttp.NewHandler(router, "")

httpServer := &http.Server{
	Handler: handler,
}
You can then retrieve the active span context and pass it to other functions:
ctx := req.Context()
op1(ctx)
op2(ctx)
Uptrace
Uptrace is an open-source APM that supports distributed tracing, metrics, and logs. You can use it to monitor applications and set up automatic alerts to receive notifications via email, Slack, Telegram, and more.
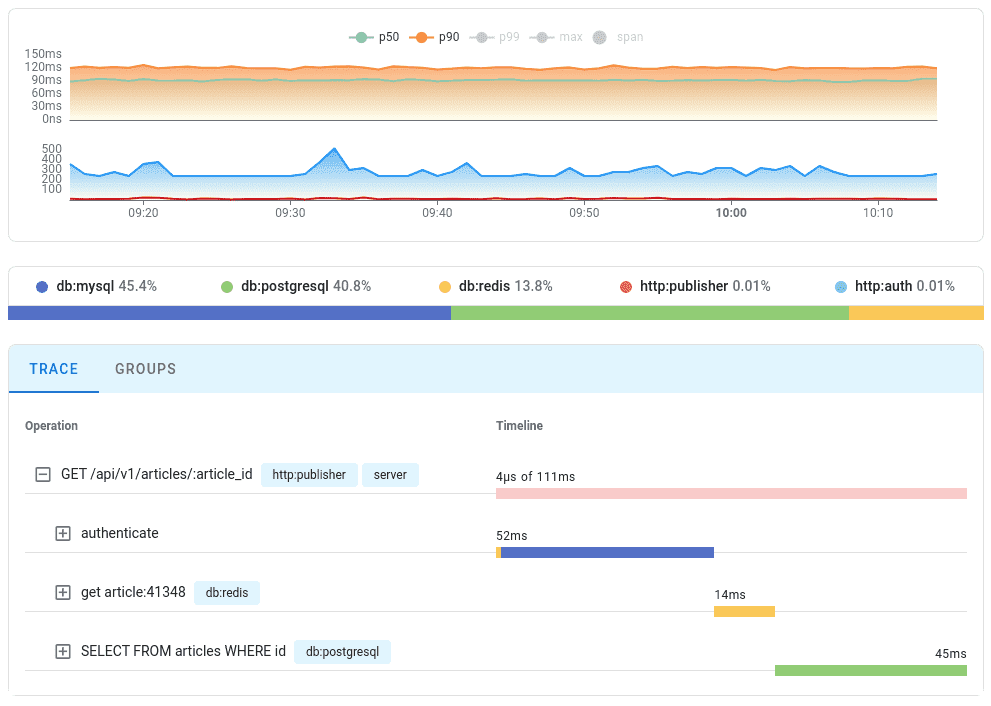
BunRouter instrumentation creates spans for processed requests and records any errors as they occur. Here is how the collected information is displayed at Uptrace:
You can find a runnable example on GitHub.